POSTED IN
Marketing
WRITTEN BY
Nay Madani
DATE
Who said problems in the company could not arise because of ineffective information delivery? Imagine when your big company has many branches with hundreds to millions of employees. Then, you want to explain procedures, documents, or essential information to your worldwide units. Moreover, said information is critical, and it is mandatory for all employees to understand. What can you do to overcome this obstacle? The answer is to create infographics to communicate precisely and accurately.
Why use infographics? You can use infographics with various styles according to your needs to convey any information through it. Infographics can turn pages of text into a single image that is both easy to digest and aesthetically pleasing. Not only for internal teams, but you can also use infographics for external uses such as product promotion, marketing, and public relations purposes for your business.
So, infographics can help all lines of your business, internally and globally.
Infographics are not as simple as the name suggest
‘Info’ and ‘graphic’ are two words that describe a vital message in the image. But actually, the role of infographics for business is related to more than just the visualization of information. It has an influential role in explaining things effectively and efficiently.
– It converts thousands of paper into a single image
How can sheets of paper be converted into a single image? That is the main power that infographics have. Infographics can grab the audience’s attention with an attractive title and compact content. Remember to match the context of the data with the visuals because both must come together. In the long run, your audience will easily remember the impactful, clear, and understandable writing in the images.
– It guides the learner through a logical hierarchy
Writing storytelling in an infographic should be logical and concise. A good structure must contain a background following the information and data presented. Therefore, your message should move the data intuitively when your audience reads it. Infographic helps you in creating modular content design and structure. This method facilitates cognitive configuration and makes it simple for the eye to process individual panels one at a time. Thus, humans’ eyes will go from 1 to 10 sequentially.
– It highlights notable story insights
With infographics, you can get conclusions, solutions, or discoveries you weren’t aware of through text alone. Since the infographic provides a straightforward and precise story, it’s crucial to mention the main points explicitly. Even if your tale or message is well-defined, your tone should be analytical rather than judgmental. The addition of bias caused by the intrusion of opinion raises concerns about the data’s objectivity. Furthermore, you want the learner to comprehend the story’s ending once you’ve given your account with the observable facts. Therefore, providing a conclusion, answer, or suggestion is essential.
Communicate your message through infographics
The application of infographics varies for numerous needs. For example, there is an infographic specifically for one thing. But you can combine several infographics to present compact and thorough information. So, understand the types of infographics through the explanation below.
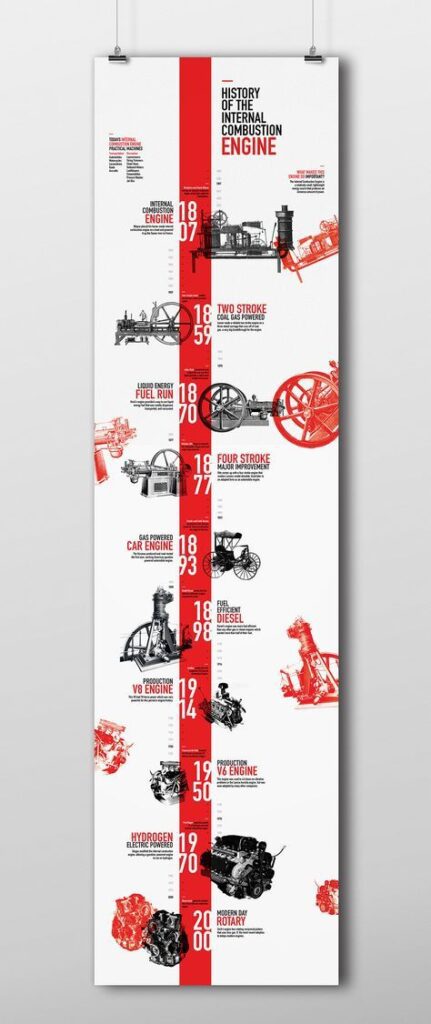
1. Chronological Infographic
This infographic helps you explain stories and stages of work or show critical events in chronological order. Explain things sequentially so that the audience can see the progress of your account from beginning to end.

2. Process infographic
Do you need help explaining a process or how things work? First, use process infographics to explain procedures, instructions, and steps you must carry out from start to finish. Then, accomplish your process through numbered steps or a flow chart.

3. Statistical Infographic
This infographic is suitable for showing the results of surveys, research, or data to the audience. The first method is highlighting the numbers significant to the audience. The other way is to make it happen through graphs, pictograms, or other visual elements.

4. Informative infographic
This type of infographic is the one we see most often. First, convey an idea or concept, an important message, or a story summary to outline a topic with outline points. Then, use simple illustrations or icons to spice up the visuals.

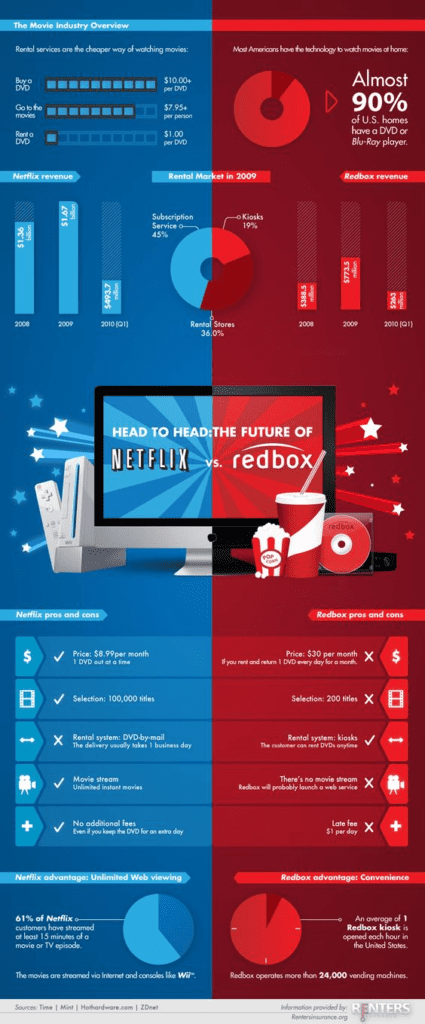
5. Comparison infographic
Compare two or more different things using this infographic. Audiences need clear visuals to compare two separate things to help them choose. As a result, the audience can choose something according to their needs.

Craft your outstanding infographic with Nice To Meet You Studio
You already know how your business can apply infographics to many things. Infographics can fit everything aesthetically, from minor to plenty, from smaller to bigger things. Through infographics, you can convey key messages to your audience quickly and precisely because the human brain works visually.
Now, it’s time to create a captivating infographic for your business. With Nice To Meet You Studio, we can provide various infographics for your social media needs, presentations, and products for your company’s technical internal and external goals. In addition, you will get a bonus of a Project Manager who will take care of all partnerships from beginning to end. We help businesses globally since Nice To Meet You Studio is a remote design service for all company lines.
Don’t forget to visit our website and Instagram @nicetomeetyou.studio to check on our portfolio!


